
Leichhardt OvalLeichhardt, New South Wales, Australia
- Games
- 50
- Record
- 26-2-22
- Win %
- 52.0%
- PF
- 887
- PA
- 888
- Span
- 12 Mar 1994 – 01 Jul 2000


 Placeholder image
Coach
CoachVenueRec and CoachVenueRecYear
Ground-by-ground coaching results with career spans and year-by-year venue records.

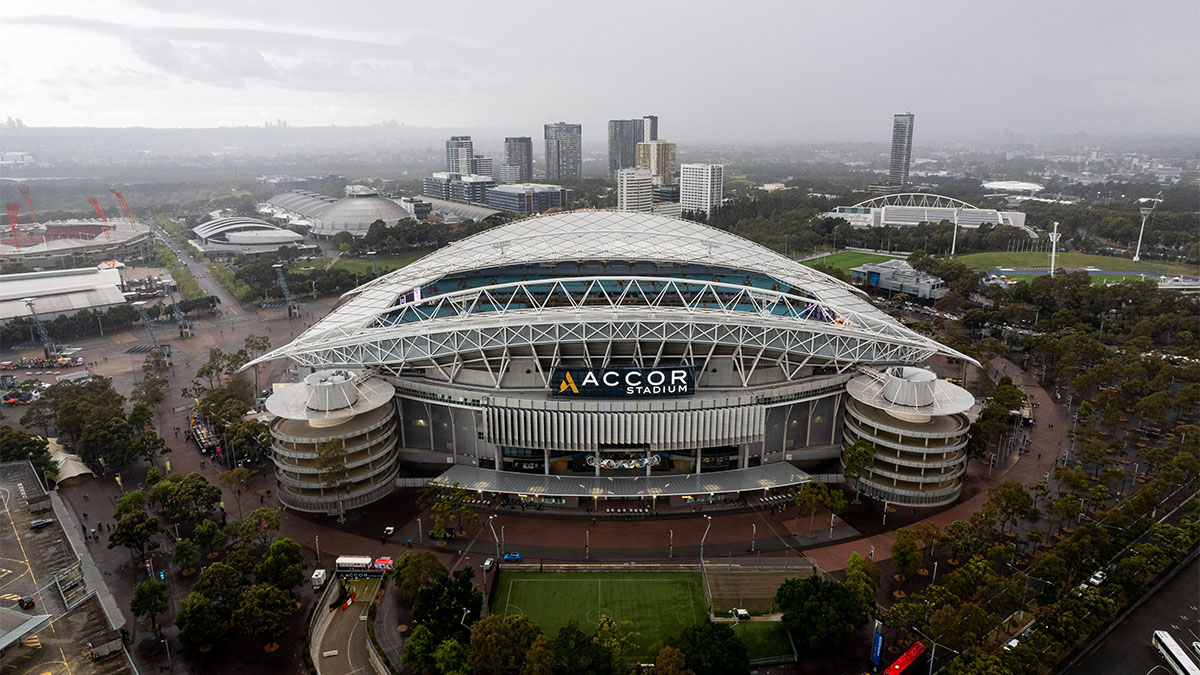
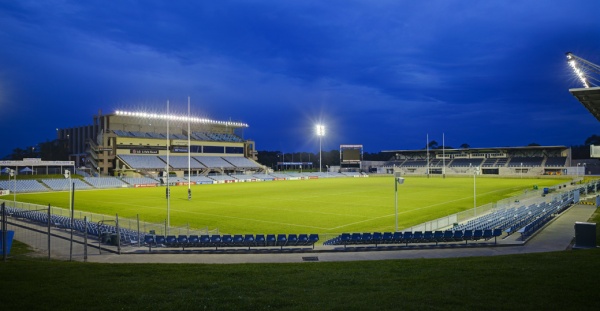

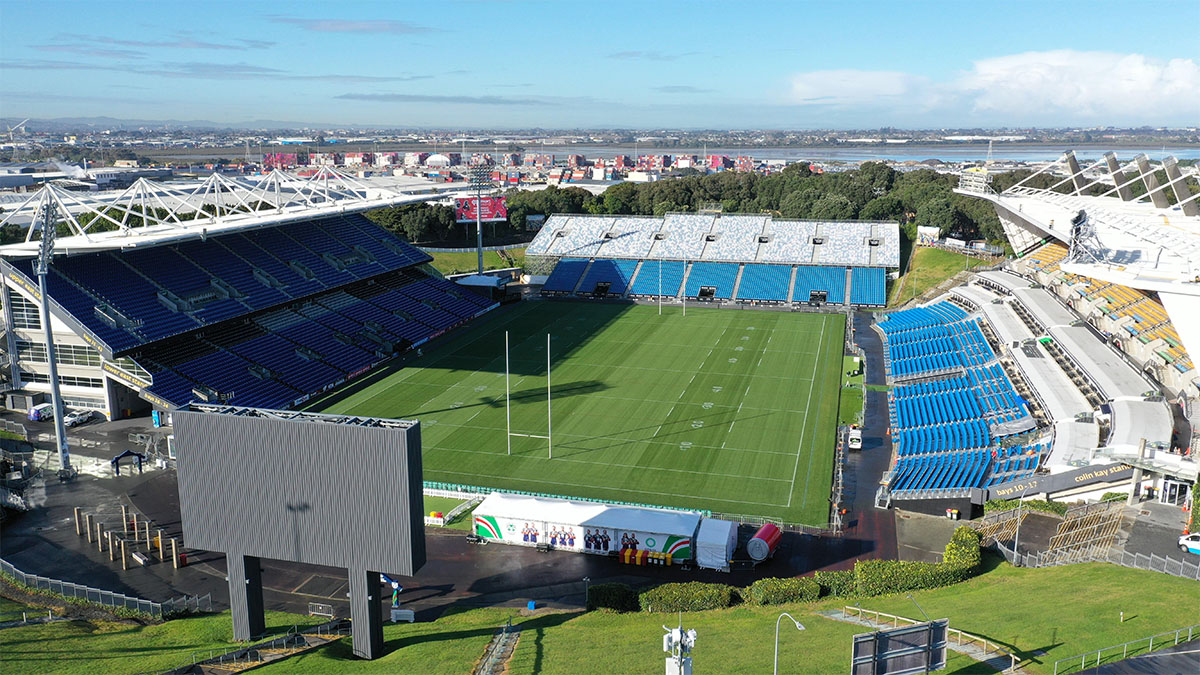


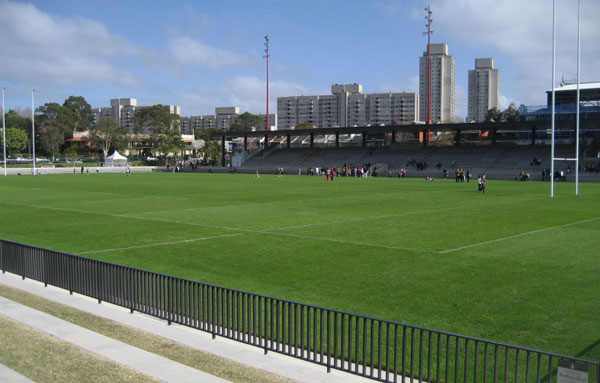
| Year | Venue | Games | W | D | L | Win % | PF | PA | Diff |
|---|---|---|---|---|---|---|---|---|---|
| 2,001 | Accor Stadium | 1 | 1 | 0 | 0 | 100.0% | 26 | 8 | 18 |
| 2,001 | Lang Park | 1 | 0 | 0 | 1 | 0.0% | 16 | 34 | -18 |
| 2,001 | Queensland Sport and Athletics Centre | 1 | 0 | 0 | 1 | 0.0% | 14 | 40 | -26 |
| 2,000 | Leichhardt Oval | 7 | 5 | 1 | 1 | 71.4% | 139 | 108 | 31 |
| 2,000 | Campbelltown Sports Stadium | 6 | 1 | 1 | 4 | 16.7% | 142 | 176 | -34 |
| 2,000 | Accor Stadium | 3 | 2 | 0 | 1 | 66.7% | 102 | 68 | 34 |
| 2,000 | BlueBet Stadium | 1 | 0 | 0 | 1 | 0.0% | 31 | 32 | -1 |
| 2,000 | GIO Stadium | 1 | 0 | 0 | 1 | 0.0% | 22 | 24 | -2 |
| 2,000 | Go Media Stadium | 1 | 1 | 0 | 0 | 100.0% | 30 | 4 | 26 |
| 2,000 | Lang Park | 1 | 1 | 0 | 0 | 100.0% | 28 | 10 | 18 |
| 2,000 | McDonald Jones Stadium | 1 | 0 | 0 | 1 | 0.0% | 8 | 46 | -38 |
| 2,000 | Ocean Protect Stadium | 1 | 1 | 0 | 0 | 100.0% | 16 | 12 | 4 |
| 2,000 | Olympic Park Stadium | 1 | 0 | 0 | 1 | 0.0% | 10 | 40 | -30 |
| 2,000 | Parramatta Stadium | 1 | 1 | 0 | 0 | 100.0% | 18 | 16 | 2 |
| 2,000 | Polytec Stadium | 1 | 1 | 0 | 0 | 100.0% | 18 | 10 | 8 |
| 2,000 | Queensland Sport and Athletics Centre | 1 | 0 | 0 | 1 | 0.0% | 12 | 56 | -44 |
| 2,000 | Sydney Football Stadium (Old) | 1 | 0 | 0 | 1 | 0.0% | 6 | 35 | -29 |
| 2,000 | Willows Sports Complex | 1 | 0 | 0 | 1 | 0.0% | 26 | 38 | -12 |
| 2,000 | WIN Stadium | 1 | 1 | 0 | 0 | 100.0% | 15 | 9 | 6 |
| 1,999 | Leichhardt Oval | 12 | 8 | 0 | 4 | 66.7% | 209 | 200 | 9 |
| 1,999 | Accor Stadium | 2 | 1 | 0 | 1 | 50.0% | 36 | 52 | -16 |
| 1,999 | GIO Stadium | 2 | 0 | 0 | 2 | 0.0% | 28 | 86 | -58 |
| 1,999 | Lang Park | 2 | 0 | 1 | 1 | 0.0% | 18 | 19 | -1 |
| 1,999 | Campbelltown Sports Stadium | 1 | 0 | 0 | 1 | 0.0% | 12 | 18 | -6 |
| 1,999 | Go Media Stadium | 1 | 0 | 0 | 1 | 0.0% | 4 | 22 | -18 |
| 1,999 | North Sydney Oval | 1 | 0 | 0 | 1 | 0.0% | 12 | 64 | -52 |
| 1,999 | Ocean Protect Stadium | 1 | 0 | 0 | 1 | 0.0% | 0 | 44 | -44 |
| 1,999 | Parramatta Stadium | 1 | 0 | 0 | 1 | 0.0% | 12 | 26 | -14 |
| 1,999 | Queensland Sport and Athletics Centre | 1 | 0 | 0 | 1 | 0.0% | 10 | 42 | -32 |
| 1,999 | Sydney Football Stadium (Old) | 1 | 0 | 0 | 1 | 0.0% | 12 | 22 | -10 |
| 1,999 | Willows Sports Complex | 1 | 0 | 0 | 1 | 0.0% | 14 | 20 | -6 |
| 1,999 | WIN Stadium | 1 | 0 | 0 | 1 | 0.0% | 8 | 48 | -40 |
| 1,998 | Leichhardt Oval | 12 | 5 | 1 | 6 | 41.7% | 212 | 200 | 12 |
| 1,998 | GIO Stadium | 2 | 0 | 0 | 2 | 0.0% | 30 | 42 | -12 |
| 1,998 | Belmore Sports Ground | 1 | 1 | 0 | 0 | 100.0% | 24 | 10 | 14 |
| 1,998 | BlueBet Stadium | 1 | 0 | 0 | 1 | 0.0% | 18 | 32 | -14 |
| 1,998 | Go Media Stadium | 1 | 0 | 0 | 1 | 0.0% | 20 | 21 | -1 |
| 1,998 | Hindmarsh Stadium | 1 | 0 | 0 | 1 | 0.0% | 0 | 52 | -52 |
| 1,998 | Metricon Stadium | 1 | 1 | 0 | 0 | 100.0% | 18 | 4 | 14 |
| 1,998 | North Sydney Oval | 1 | 0 | 0 | 1 | 0.0% | 6 | 22 | -16 |
| 1,998 | Ocean Protect Stadium | 1 | 1 | 0 | 0 | 100.0% | 11 | 10 | 1 |
| 1,998 | St George Venues Jubilee Stadium | 1 | 0 | 0 | 1 | 0.0% | 2 | 28 | -26 |
| 1,998 | Willows Sports Complex | 1 | 0 | 0 | 1 | 0.0% | 2 | 26 | -24 |
| 1,998 | WIN Stadium | 1 | 1 | 0 | 0 | 100.0% | 38 | 16 | 22 |
| 1,997 | Leichhardt Oval | 11 | 6 | 0 | 5 | 54.5% | 199 | 145 | 54 |
| 1,997 | Sydney Football Stadium (Old) | 2 | 1 | 0 | 1 | 50.0% | 26 | 20 | 6 |
| 1,997 | Campbelltown Sports Stadium | 1 | 0 | 0 | 1 | 0.0% | 10 | 20 | -10 |
| 1,997 | GIO Stadium | 1 | 1 | 0 | 0 | 100.0% | 14 | 10 | 4 |
| 1,997 | Lang Park | 1 | 1 | 0 | 0 | 100.0% | 18 | 16 | 2 |
| 1,997 | McDonald Jones Stadium | 1 | 0 | 0 | 1 | 0.0% | 10 | 34 | -24 |
| 1,997 | Metricon Stadium | 1 | 0 | 0 | 1 | 0.0% | 6 | 26 | -20 |
| 1,997 | North Sydney Oval | 1 | 0 | 0 | 1 | 0.0% | 14 | 22 | -8 |
| 1,997 | Parramatta Stadium | 1 | 0 | 0 | 1 | 0.0% | 14 | 25 | -11 |
| 1,997 | St George Venues Jubilee Stadium | 1 | 0 | 0 | 1 | 0.0% | 10 | 16 | -6 |
| 1,997 | WIN Stadium | 1 | 1 | 0 | 0 | 100.0% | 18 | 6 | 12 |
| 1,996 | Parramatta Stadium | 11 | 6 | 0 | 5 | 54.5% | 173 | 230 | -57 |
| 1,996 | Sydney Football Stadium (Old) | 2 | 0 | 0 | 2 | 0.0% | 14 | 70 | -56 |
| 1,996 | AMI Stadium | 1 | 1 | 0 | 0 | 100.0% | 34 | 22 | 12 |
| 1,996 | Belmore Sports Ground | 1 | 1 | 0 | 0 | 100.0% | 20 | 18 | 2 |
| 1,996 | BlueBet Stadium | 1 | 1 | 0 | 0 | 100.0% | 18 | 16 | 2 |
| 1,996 | GIO Stadium | 1 | 0 | 0 | 1 | 0.0% | 0 | 18 | -18 |
| 1,996 | Lang Park | 1 | 1 | 0 | 0 | 100.0% | 12 | 2 | 10 |
| 1,996 | McDonald Jones Stadium | 1 | 1 | 0 | 0 | 100.0% | 24 | 12 | 12 |
| 1,996 | Metricon Stadium | 1 | 0 | 0 | 1 | 0.0% | 16 | 28 | -12 |
| 1,996 | Queensland Sport and Athletics Centre | 1 | 0 | 0 | 1 | 0.0% | 6 | 26 | -20 |
| 1,996 | Willows Sports Complex | 1 | 0 | 0 | 1 | 0.0% | 2 | 17 | -15 |
| 1,995 | Parramatta Stadium | 12 | 6 | 0 | 6 | 50.0% | 203 | 285 | -82 |
| 1,995 | Campbelltown Sports Stadium | 1 | 0 | 0 | 1 | 0.0% | 12 | 30 | -18 |
| 1,995 | GIO Stadium | 1 | 0 | 0 | 1 | 0.0% | 10 | 28 | -18 |
| 1,995 | Go Media Stadium | 1 | 0 | 0 | 1 | 0.0% | 12 | 36 | -24 |
| 1,995 | North Sydney Oval | 1 | 0 | 0 | 1 | 0.0% | 4 | 36 | -32 |
| 1,995 | Ocean Protect Stadium | 1 | 0 | 0 | 1 | 0.0% | 16 | 30 | -14 |
| 1,995 | Redfern Oval | 1 | 0 | 0 | 1 | 0.0% | 10 | 18 | -8 |
| 1,995 | St George Venues Jubilee Stadium | 1 | 0 | 0 | 1 | 0.0% | 6 | 34 | -28 |
| 1,995 | Sydney Football Stadium (Old) | 1 | 0 | 0 | 1 | 0.0% | 6 | 44 | -38 |
| 1,995 | WACA Ground | 1 | 0 | 0 | 1 | 0.0% | 6 | 22 | -16 |
| 1,995 | Willows Sports Complex | 1 | 1 | 0 | 0 | 100.0% | 28 | 14 | 14 |
| 1,995 | WIN Stadium | 1 | 0 | 0 | 1 | 0.0% | 6 | 32 | -26 |
| 1,994 | Leichhardt Oval | 8 | 2 | 0 | 6 | 25.0% | 128 | 235 | -107 |
| 1,994 | Ikon Park | 2 | 0 | 0 | 2 | 0.0% | 20 | 58 | -38 |
| 1,994 | Parramatta Stadium | 2 | 1 | 0 | 1 | 50.0% | 20 | 30 | -10 |
| 1,994 | Belmore Sports Ground | 1 | 0 | 0 | 1 | 0.0% | 8 | 24 | -16 |
| 1,994 | Campbelltown Sports Stadium | 1 | 0 | 0 | 1 | 0.0% | 28 | 32 | -4 |
| 1,994 | Kitchener Park (Gunnedah) | 1 | 0 | 0 | 1 | 0.0% | 4 | 16 | -12 |
| 1,994 | McDonald Jones Stadium | 1 | 1 | 0 | 0 | 100.0% | 11 | 6 | 5 |
| 1,994 | Narrandera Sports Ground | 1 | 1 | 0 | 0 | 100.0% | 32 | 22 | 10 |
| 1,994 | North Sydney Oval | 1 | 0 | 0 | 1 | 0.0% | 18 | 54 | -36 |
| 1,994 | Ocean Protect Stadium | 1 | 0 | 0 | 1 | 0.0% | 16 | 24 | -8 |
| 1,994 | Queensland Sport and Athletics Centre | 1 | 0 | 0 | 1 | 0.0% | 6 | 41 | -35 |
| 1,994 | Seagulls Stadium | 1 | 0 | 0 | 1 | 0.0% | 6 | 32 | -26 |
| 1,994 | St George Venues Jubilee Stadium | 1 | 0 | 0 | 1 | 0.0% | 6 | 46 | -40 |
| 1,994 | Sydney Cricket Ground | 1 | 0 | 0 | 1 | 0.0% | 24 | 26 | -2 |
| 1,994 | Sydney Football Stadium (Old) | 1 | 1 | 0 | 0 | 100.0% | 23 | 16 | 7 |
| 1,994 | WACA Ground | 1 | 0 | 0 | 1 | 0.0% | 0 | 24 | -24 |